Real Rates Tsunami: Has it Reached the Coast?

In this letter I would like to discuss the dynamics of economic growth and inflation that have been developing over the last three years. Much of this I have written about in prior investor letters; my goal here is to communicate and summarize my most up-to-date understanding of these dynamics and what this means for market expectations.

It is no secret that some events unfolded differently than I expected. This period has given me a greater understanding of inflationary dynamics that I hope to utilize in future investments. As always, my understanding of the situation will continue to evolve as new information comes in.

My purpose here is not to share new economic theories or proprietary research, but to show my investors the current paradigm in which I design my portfolio.

In 2020 we experienced an unprecedented flood of fiscal and monetary stimulus. It was during this time that my concerns over inflation were at their highest, as I anticipated the Fed to be extremely slow to raise rates regardless of the data. When rhetoric changed in 2021 and I realized the Fed would be reacting to the data after all, my concerns evaporated and I joined TEAM TRANSITORY.

This team (our team) got some things right and some things wrong. In terms of prices in the bond market, the team was clearly wrong.

So, what was right?

Team Transitory believed that post COVID-19 there would be a sharp spike in inflation, which would unwind just as sharply afterwards. This is indeed what happened and is demonstrated by the figure in Chart 1. I will discuss below why I am convinced that this unwind cannot be attributed solely to policy.

US Headline CPI YoY (%)

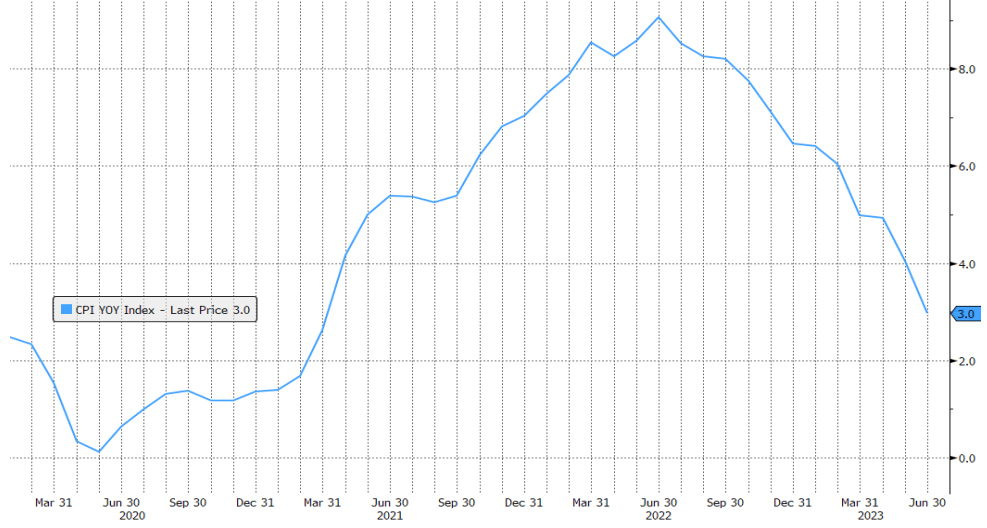
It is true the spike was even worse than many had expected, due to worse-than-anticipated supply issues.

However, the supply crunch and subsequent unwind would only reinforce the underlying thesis of Team Transitory.

So, what was wrong?

I was asked (I believe in late 2021) “at what point would Team Transitory throw in the towel?” My answer was, “Transitory is not about how long it lasts, but whether inflation is self-reinforcing or self-arresting.” There were various compelling arguments for both, but it was eventually determined that the inflation was self-reinforcing, which undermined the case of Team Transitory.

What we are seeing now are the broad lingering effects of 2021’s expansionary monetary policy (extremely negative real interest rates and QE persisting in the face of rising asset prices).

The important lesson was that it did not matter why inflation was high in 2021, as the policy rate stayed near zero. Supply-driven inflation, running at close to 9% annualized, metastasized in stickier areas of the economy, such as services, and fueled labor shortage and wage pressure.

Was the Fed wrong to keep rates at zero for so long? Most people would emphatically say yes. I am not so sure. For the reasons I will discuss below it may have been sufficient to just start unwinding the balance sheet earlier and more aggressively. The point, however, is moot. I am not in the business of advising central bankers. In either case, the Fed’s mandate is so nebulous that it is almost impossible to pass judgment on the efficacy of their policy. What is more important is to understand the timeline of the policy’s impact on inflation. Remember that Jay Powell himself acknowledges that the policy lags are “long and variable.”

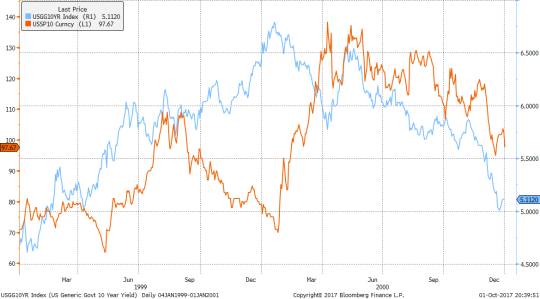
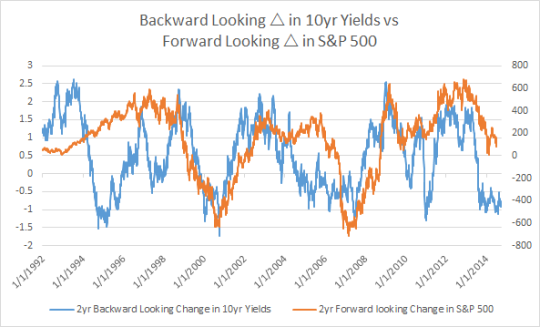
Notice, the peak policy impulse was in the spring of 2020 and peak inflation was in the spring of 2022. Those who follow my writing will recognize the magic two years: the lag between the interest rate momentum and the stock market momentum. This is demonstrated by what could be my all-time favorite chart.

2YR Backward Looking US 10YR Yield Differential vs 2YR Forward Looking S&P500 @ Change

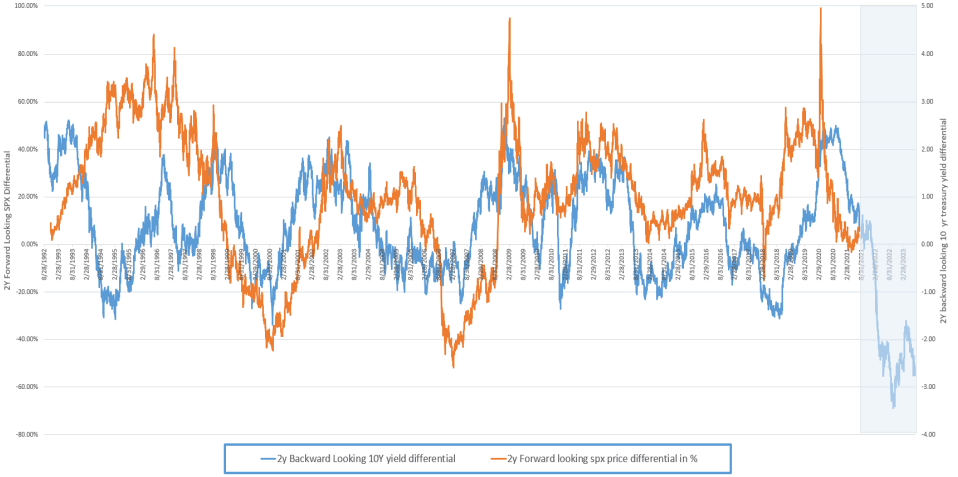
It seems that the economy works in two-year cycle turnarounds. Correspondingly, the magic two years has been my favorite time horizon for trades.

Why is the lag so extreme? I am not going to analyze the economic process here, but I want to point out that peak policy impulse (i.e. the change in policy) is not the same as peak policy.

Indeed, the most amount of stimulus and the deepest rate cuts occurred in March 2020. However, due to the extreme deflationary impact of the pandemic, real rates were quite positive. The peak policy arrived in 2021, when inflation spiked and asset prices soared, while the rates remained at zero.

US Real Rate (Fed Fund Monthly Settle net Unrounded Headline CPI MoM Ann.), since 2020

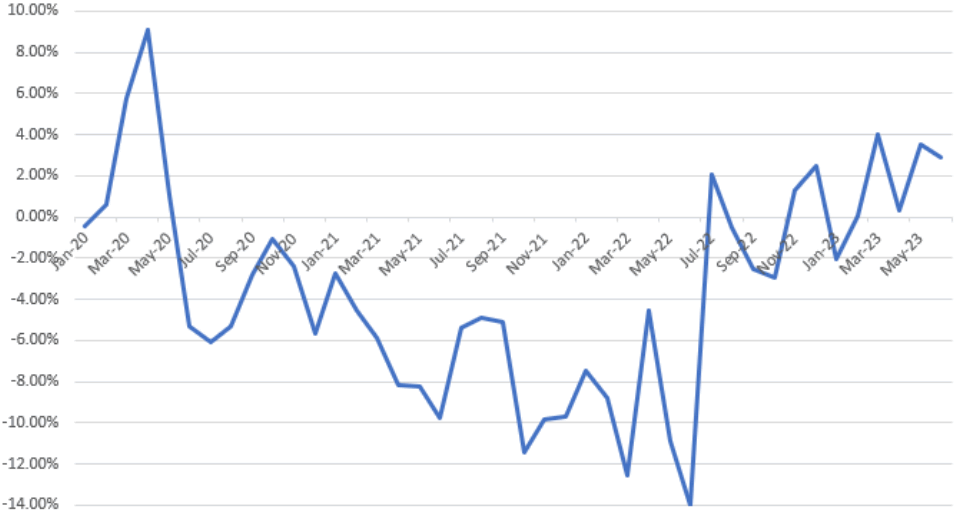
Looking through this lens, the lag between the peak easy policy and peak YOY inflation was closer to one year!

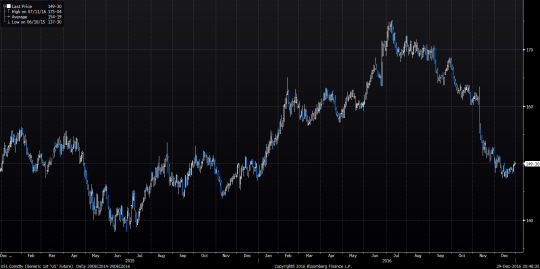
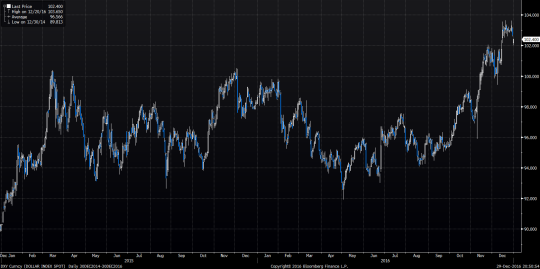
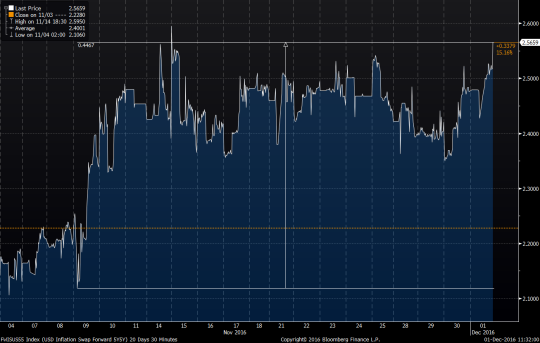
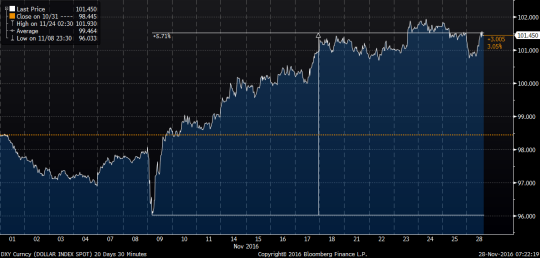
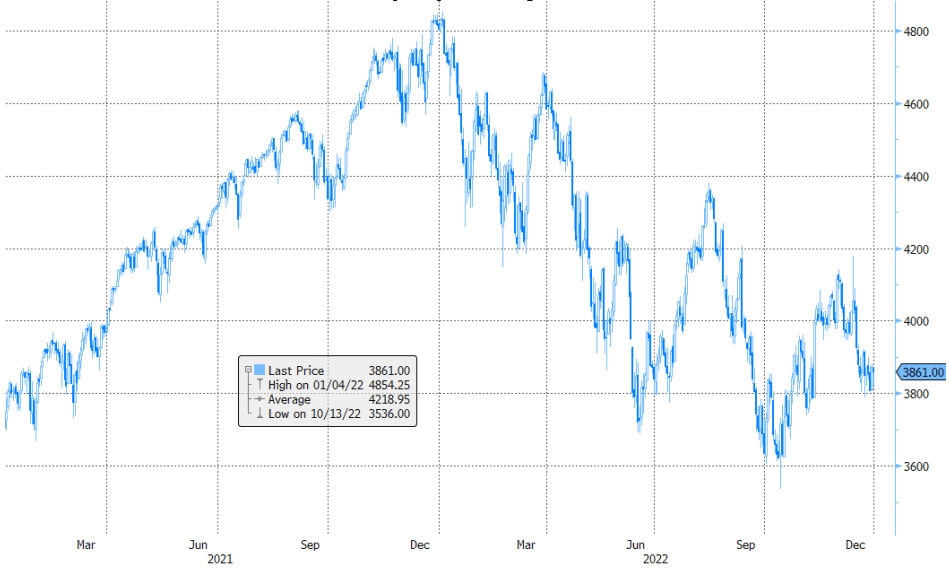
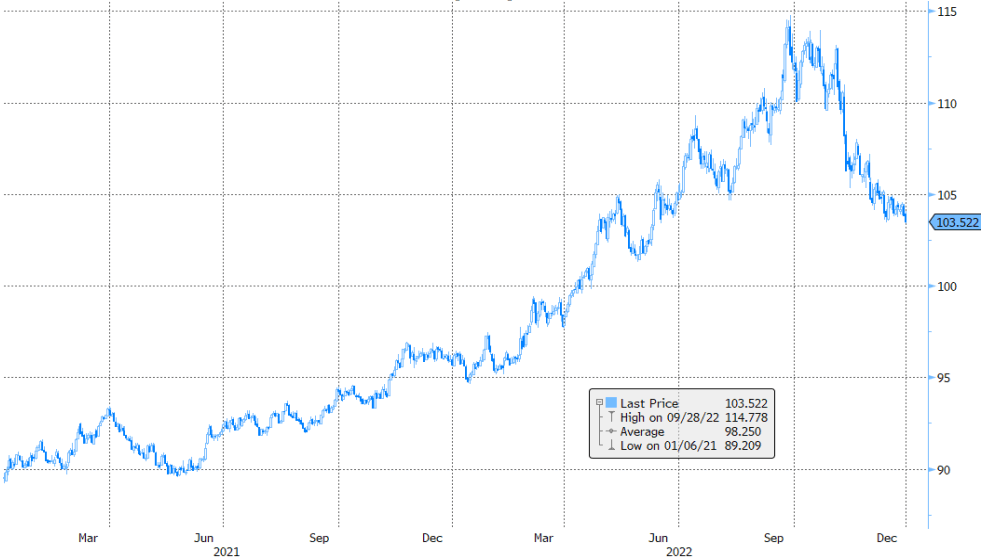
Let’s take it one step further. By mid-2022 I was convinced that the change in policy was getting traction. This was the time of the peak tightening impulse; the Fed was hiking at 75 basis per meeting, asset prices were falling, and the dollar was rallying.

S&P500 Future (ES1), roll adjusted, 2021-2022

US Dollar Index (DXY), since 2021-2022

Hence, I started targeting mid-to-end-2024 for peak deflation.

Notice that I am circumventing the Financial Condition Index as I don’t have much faith in its predictive power.

Rather, I would focus on the policy itself. In early 2022, the policy was not tight at all, and real rates were still very negative.

Then what about the economic slowdown and the technical recession of 2022? What about the marked decline of inflation between mid-2022 and mid-2023 that we referred to at the beginning of this letter? Enter again, Team Transitory. By any notion of the lag, those slowdowns could not have been the result of policy, but instead were the unwinds of the post-covid bumps.

Let’s return to our earlier observation: inflation is self-reinforcing. It doesn’t matter why headline inflation collapsed over the last year. The important thing is, with all else being equal, it will lead to further disinflation. This is where I come back to whether the extreme hiking cycle was necessary. Indeed, we have established that inflation has slowed down on its own and is feeding into lower inflation going forward. Raising rates now doesn’t aid this process, but only increases the risk of a deflationary bust in the future.

We hear a lot of talk about how we have likely avoided the recession. Honestly, I find such arguments nonsensical.
By which I don’t mean that they are a priori wrong, rather that they are completely unfounded. Only recently have real rates crossed into positive territory, and given the lag, how can we possibly know what effects they “had” on growth?

I believe what causes confusion is the order of events. We (myself included) have been trained to anticipate a particular pattern at the end of a business cycle:

  • Interest rates rise
  • Stock market crashes
  • Economy slows
  • Unemployment rises
  • Inflation declines

However, somewhere between the economy slowing and unemployment rising the world failed to cooperate.

Why is it different this time? The pandemic crisis developed more rapidly than any prior recession and was met with an unprecedented amount of stimulus. The cash that was poured into the system by the government strengthened consumer balance sheets.

When rates go up it hurts those who need to borrow, but those who have excess cash or those who have already locked in low, long-term rates on borrowing (such as thirty-year fixed mortgages) come out just fine. Hence, the hikes didn’t immediately put pressure on (relatively) cash-rich consumers. Also, corporations boosted by the ability to borrow at negative real rates had no pressure to slow down hiring.

Moreover, the recent downshift in headline inflation, combined with the continuing tightness of the labor market, led to the increase in real wages and a further tailwind for the purchasing power of consumers.

Does this mean the economy is out of the woods? Not at all. The sentiment is positive, but if markets could thrive on sentiment alone bull markets and periods of economic expansion would never end.

The effect of higher real wages is almost immediate. Other effects of higher real rates may take longer to play out as money supply tightens. Even if the consumer and the stock market stay strong, fewer dollars in circulation will likely mean lower final demand in terms of dollars. It is hard to predict which shoe will drop first (like most, for example, I didn’t anticipate the regional banking crisis). Like in the game of musical chairs, if you keep taking dollars out of the system, sooner or later someone will come up short.

The pattern could be as follows:

  • Interest rates rise
  • Inflation declines and real rates rise
  • Unemployment rises
  • Economy slows
  • Stock market crashes (or not)

I believe it is safe to assume the idea of a benign Fed pivot is a thing of the past. Given the policy lags discussed above, and the determination of the central bankers to see inflation fall to 2% before they take any easing action, it is almost impossible to hope the pendulum will not be allowed to swing too far in the deflationary direction.

In theory, the Fed would have to have already been cutting rates to match the disinflation. The reality is that they are still conducting QT as higher and higher real rates work their way through the system. As monthly inflation falls to zero and below, real rates will remain restrictive until the Fed cuts to zero and starts a new QE program. It is hard to imagine this transition occurring in time to avoid spiraling deflation.

One might observe that throughout this letter I have not mentioned any of the geopolitical, demographic, or technological factors which might affect the inflation outlook. There are two reasons for this.

First, is the time horizon. Over a two-year period cyclical forces tend to overpower secular forces, and at this juncture, I see cyclical forces as preeminent.

Second, the impact of secular forces is very hard to forecast. Consider the following examples:

  • On-shoring and friend-shoring may be inflationary, but it may cause a severe recession in China. This in
    turn would send a deflationary shockwave around the globe.
  • Green energy transition and lack of prospecting for fossil fuels may be viewed as inflationary, but in the
    environment of tight dollar supply, high energy prices may slow global growth.
  • Baby boomers retiring leads to tighter labor markets but can also lead to lower consumption and lower
    asset prices.
  • Generative AI may lead to a dramatic increase in productivity and be viewed as deflationary, but it can
    also accelerate global growth and create new types of jobs.

I have also not focused on the fiscal impulse. Three reasons for that are:

  • It is not clear whether it is more important that fiscal policy is still expansionary or that it is less expansionary than in 2020.
  • Up until the next election the US Government is divided, limiting the ability for further stimulus until mid2025. Even after the election, the situation is hard to predict.
  • Fiscal expansion without monetary accommodation may or may not be inflationary. Deficit spending is stimulative, but selling extra Treasuries to fund it might suck the money back out of the system.

Lastly, I haven’t discussed the “what if I’m wrong” aspect of my current portfolio construction. I believe there are good risk-reward trades currently available that take advantage of the environment in which my inflation outlook would be proven incorrect. My aspiration has always been to build as balanced a portfolio as possible. In this letter, however, I specifically express my views on inflation and duration.

I like to say that in the markets there are no certainties, only certain likelihoods. Hence, I would summarize the likelihoods I currently see in the following way:

  1. The inflationary cycle has swung in the direction of deflation and is currently self-reinforcing.
  2. It is too early to judge the effect of the hiking cycle on growth.
  3. During this cycle the slowdown in inflation will likely lead to the slowdown in growth via the mechanism of higher real rates.
  4. Secular and fiscal forces introduce uncertainties that I can’t measure, but I believe the cyclical deflationary forces will prevail over the two-year horizon.
  5. Faced with spiraling deflation the Fed will have no choice but to return to ZIRP, making long bond duration an excellent opportunity.

Good luck and stay healthy!

Alex Gurevich
Founder and CIO
HonTe Advisors, LLC

Century Bonds

For a couple of months now I’ve been poking some fun on social media of those who attempted to short Austrian 100-year bonds. The biggest short is, of course, the Austrian government; the hapless issuer is by definition short. Indeed, if you issue bonds at par and they go to 210, you have in effect set taxpayers’ money on fire. Because if you waited and haven’t forgone the opportunity cost, you could’ve raised 2.1 times more money while undertaking the same obligations.

Austria 100yr Bond Price (RAGB 2.1% 9/20/2017)

And now, the United States and Germany are contemplating joining the ultra-longdated bonds club.

There are mistakes and there are mistakes. Sometimes any of us can just be wrong about market direction. We did our homework, analyzed what we could, and made the best educated guess. And then things played out differently due to unaccounted factors, exogenous events, or adverse flows.

And then sometimes we get involved in trades when we don’t properly understand the underlying instrument and the risks involved, ending up with a portfolio not corresponding to our internal positioning logic. Unfortunately, even experienced traders are not completely immune to this second category of errors. But, certainly, such instances raise some red flags.

Only an investor not properly understanding the concept of convexity would think that shorting a 100-year bond at 2% yield is a good risk-reward proposition. I discussed this bond math in a market note several years ago. Indeed, if yields were to go to infinity the bond price can only go to zero, delivering a 100% gain to the speculator, but if yields were to fall to zero (and as we know now zero is not the final bound) their loss is 200%.

Is there no level at which long-dated bonds are a short? I like to think there is a price for everything in financial markets. There is a level to sell super long-dated bonds, but not a level to sell them safely.

The argument that we should take advantage of historically low interest rates is profoundly fallacious in the presence of multi-decade secular trend as can be seen in the total return of US classic bond futures below. It is the same as to say that my age is historically high, so I can’t get any older.

US Long Bond Futures, Total Return since 1985

One could reasonably argue that the recent rally in the long end is tactically overextended. OK, brave souls, trade this overextension, but it is not the job of the Treasury to engage in short-term speculation.

First time I became involved in the discussion of super long-term bond issuance was when it was floated shortly after the US Election in 2016. In my interview for the Economist, I pointed out that issuing any long-dated bonds, including 30 years, had been a consistent and negligent waste of taxpayers’ money for decades. Were the USA to issue $10bln of 100 year bonds at the end of 2016 they would currently trade at least 120bp lower, costing the US approximately $4billion.

Sure, now is a better time than back then. Just as “then” was a better time than 10 years prior. But hasn’t the Treasury sufficiently banged its head on the wall by issuing 30 years long enough to not be asking for more punishment?

One could argue that interest on Treasuries is not a total waste given that much of it goes to pension funds and other savers. But if we were to follow this logic the objective would be to pay as much interest as possible! No, logically the government should fund itself as cheaply as possible and then decide what to do with the surplus. Especially so in the case of a current account deficit country like the United States, with much of the sovereign debt being held by foreign investors.

So, with respect to ultra-long-term debt, short-sellers, beware. And, issuers, just stop!

Good luck,

Alex Gurevich CIO, HonTe Advisors, LLC

Central Banks and Sour Grapes

“Sour Grapes” is my response to all the complaining about central
banks (“CBs”) distorting markets, ruining price discovery, and leading their
countries into the hellscape of negative real rates.

Indeed, if global financial markets were a palace, the floors
would be sparkling clean: the central banks have been using their
counterparties as a mop for almost a decade.

Imagine this….

You are a monopolistic issuer of a product with nearly zero
manufacturing costs, i.e. fiat; and everyone wants to buy this product.

In fact, they are giving you real assets in exchange for it!

Your only worry in this dream-like scenario would be that at some
point the market is oversaturated with your costless product and its value
collapses, i.e. hyperinflation.

However, it doesn’t collapse!

And then it doesn’t collapse some more, and then some more, and
over time you accumulate trillions in real wealth on your balance sheet, which
was funded by the fiat you issued at the interest rate you controlled.

….

This is not fictional. The Swiss National Bank (“SNB”) has managed
to accumulate a huge fortune in foreign equities by printing Swiss franc, of
which the world doesn’t seem to have enough.

image
image
image

The Bank of Japan (“BOJ”) and the European Central Bank (“ECB”)
have also been voracious buyers of corporate securities.

image
image
image
image

*Only includes Corporate
Sector Purchase Programme (CSPP) of Asset Purchase Programme (APP).

In the case of the Fed, one can argue that all they are doing is
exchanging the spurious dollar fiat for the equally spurious US Treasury (and
mortgage-backed) paper. Spurious or not, the Treasury has managed to fund the
fiscal expansion and many real-world expenses and projects, both useful and
otherwise.

And then during quantitative easing (“QE”) alleviated the burden
of outstanding debt in several ways: 

  1. For years, the Fed paid just 0.25% on excess reserves and
    was able to fund the bonds and remit the coupon proceeds to the Treasury. Such
    remittances added up to $80-100bln a year (see Fed Remittances below).

  2. QE (arguably) kept the interest rates lower allowing the US
    to pay less interest on the new Treasury issuance. 

  3. QE pushed inflation incrementally higher, (also under dispute,
    but somewhat likely given simple demand/supply considerations) driving the real
    cost of borrowing even lower.  In fact, negative for a long period of
    time.

  4. Possibly improved tax collection, as corporate profits were
    aided by the lower interest rates and mortgage interest deductions were
    lowered. At the same time the opposite side of this equation – interest
    collected by savers – may be mostly tax sheltered in retirement accounts. Note:
    A lot of maybes here, as I am not sure of this math.
image

I am not mentioning any benefits from domestic currency weakness
caused by QE given that with all major developed market central bank’s
simultaneously engaging in QE, this is presumably a zero-sum game.

At this point some readers are probably eager to assert that,
while the central banks have been presented as omnipotent thus far, their
comeuppance is imminent. In fact, many market participants adhere to the belief
that global fiat collapse is now unavoidable and hedge their risk by
stockpiling gold and cryptocurrencies.

In my view, while fiat collapse remains an existential risk to the
global financial system, the current evidence points towards the opposite. We
are not faced with the question of whether the world will absorb the increasing
supply of cash; the world did absorb it. And the central banks, who have
managed to sell it, are now armed to the teeth to defend it.

Indeed, if, as in the case of the USA, cyclical inflation raises
its head and the economy appears in danger of the overheating, central banks
can simply start buying their fiat back. Or, in other words, reduce their
balance sheet – which is exactly what the Fed is doing with quantitative
tightening (“QT”)!

In this process, the assets on the CB balance sheet become exactly
what they are called….ASSETS.

These assets can be and are used to defend the credibility of fiat
by giving it a consistent bid.

Furthermore, if, in cases such as Switzerland or Japan, the
domestic currency was to suddenly spiral down under the weight of increasing
monetary base, the CHF and JPY could be defended by selling foreign assets.

On the flip side, the ownership of domestic sovereign debt by the
CB can be used to mitigate excessive currency strength and a deflationary
spiral as well. The BOJ, ECB, SNB and Fed all have the ultimate stop-gap of
full or partial debt jubilee as described by David Zervos in his “Bondfire of the Vanities” discussion.

Some of you may have noticed, that there is one scenario none of
the above measures would help with…Stagflation.

Personally, I am inclined to believe that stagflation is a
mythical creature, or at least an urban legend.

I know, I know, there are historical examples. (Wait, are there?).

But looking back through my couple of decades in financial
markets, everywhere I turn I see robust growth and moderating secular
inflation. The opposite of stagflation.

Of course, it is possible that the end of both the secular trend
of disinflation and the secular bull market in sovereign debt is here and now.
But I just fail to see the evidence.

Inflation remains moderate, despite a quite prodigious effort to
inflate DM economies. And where, like in the USA, cyclical inflation becomes a
threat, the policy quickly gains traction and flattens the yield curve.

And this is all happening in an environment of a very long
economic expansion. Why should I believe that inflation will become a threat in
a downturn?

Suppose I am wrong. I still struggle to see how the Fed’s large
balance sheet is a problem.

It is a problem if you are forced to sell assets when their prices
are going down. But central banks are never forced to sell, because they
control the funding.

In the hypothetical stagflationary scenario, the CBs will have a
range of possible policy options. They, for example, can
choose to keep rates very a low (even negative) to ameliorate an economic
slowdown and reduce their balance sheet to support domestic currency and
mitigate inflation.

Notice the Fed started to do things in the opposite order (e.g.
hikes first), because stagflation is not a current concern.

All of those arguments are based on the assumption that central
banks are run by intelligent people invested in the long-term prosperity of
their country. Some readers may take an issue with this assumption and if you
feel inclined to have your views swayed by this post, I would also recommend
reading Fed Up: An Insider’s Take on Why the Federal Reserve is
Bad for America
, where Danielle DiMartino
Booth presents a very different perspective.

The question of benevolence of the CB policy ties to an inquiry:
who are the aforementioned hapless counterparties? Are they just reckless hedge
fund managers going short US Treasury bonds or stocks? Or, are they the
domestic savers, including pension funds, who are deprived of yields? Or even
the millennials staring at the absurd housing prices and the absence of ways to
build wealth? Or maybe the 99% watching global monetary flows slip between
their fingers and stream into the vortex of economic singularity?

Preferring to keep the discussion strategic rather than political,
we still have to confront the trope of central banks being run by clueless
academics. Academics tend to be bright and open-minded by virtue of being
academics. Sure they don’t have a good grasp on how the real markets operate.
But neither does everyone else, including economists, strategists, financial
advisors and journalists, politicians, entrepreneurs, and corporate executives.
Anyone without experience as a global macro trader, who must contend with
interconnected financial markets, is comparable to a general who has never
fought in a war.

Yet, some generals trained in peacetime have done well. And those
“clueless academics” pulled off the greatest coup in financial history.

It is my belief that QEs were genuinely intended to, and succeeded
remarkably at, promoting the wealth of their respective nations. Any
disappointment in how this extra wealth ended up being distributed is neither
strictly within the purview of a central bank nor within the scope of this
post.

From a strategic perspective, I am only disappointed the Fed
didn’t cut rates much faster in the end of 2007, didn’t start QE earlier in
2008, and, more importantly, didn’t pursue an even more immense and broader
scale of purchases. Stronger and quicker action may have ameliorated the Great
Recession, but even if it were ineffective, I don’t see how it could have been
detrimental to the recovery.

This relatively trivial critique only confirms the success of the
CB strategy: of course, no matter how much of a profitable trade you put on,
you end up wishing you had it in a larger size.

It’s possible to debate whether the trading success of the CBs can
be evaluated on the same scale as that of other market participants. On one
hand, the CB buys and sells at market prices as everyone else, and their
product, fiat, is transparently presented. On the other hand, they are embedded
in their government, flanked by politicians, the military, and law enforcement
who protect their credibility.

Fair or not, one has to play the hand they are dealt.

And the central banks are not just playing the game well….THEY
HAVE ALREADY WON!  

Good luck,

In Quest for Digital Gold

How did gold become gold? And, more importantly, why is gold staying gold?

Silver had its run during some periods and in some cultures, but silver has become “tarnished” as a store of value.

Gold meanwhile has survived the rise of fiat and major economies moving away from the gold standard. It has also survived the loss of its utility as a convenient medium of exchange.

Certainly, gold has demand from the jewelry industry and some industrial utility. But this “natural” demand is not even a close match for the existing above-ground supply. Imagine what would happen to the price of gold if all the metal in the vaults (owned by central banks or other hoarders) were to be sold.

And yet the value holds. Significant fluctuations for sure, but in the long run, it remains stable.

I am not an expert on the history of gold. To the best of my understanding, precious metals were chosen as a medium of exchange because they do not oxidize easily and remain in an uncorrupted form. They can also be traded purely by weight and are preferable to gems, which have value heavily dependent on their shape and quality.

Amidst precious metals, however, gold is neither the rarest (platinum and palladium are harder to come by) nor quite common, like silver. Gold has solid but by no means exclusive, industrial or jewelry related demand.

My guess is that over many centuries, the precious metal has hit it’s “golden” mean; it is common enough to be a worldwide currency, but not so common that mining can disrupt its price. It is useful and decorative enough to support some underlying value, but the supply is not so tight that marginal swings in demand would create wild price fluctuations.

My assumption is that through those subtle advantages, gold has simply outlasted its competition. And, as a result, it has gained so much credibility over millennia that its value can no longer be diluted or displaced.  Today, gold (XAU = $1,275) is more expensive than platinum (XPT = $915) which is much scarcer and as useful in an industrial sense.

That said, you may have guessed by the title that this post is really not about gold, but about digital assets. Until recently, I was thinking of the dichotomy between the precedence of bitcoin and the advantages of alternative protocols. I am realizing that this dichotomy may be false.

If a universal digital store of value (“digital gold”) is to be established, it doesn’t by any means have to be, and not even likely to be, the universal medium of transactions; a fortiori, it is not likely to be a universal conduit for transactions.

Bitcoin is battling to become digital gold, while ether, for example, is elbowing to become digital copper. If the analogy holds, the price of ether will be driven by technology demand, while the price of bitcoin by the need to store liquidity. Will bitcoin cash be digital silver?

As a corollary, the rise of altcoins geared towards specific purposes is not at all dilutive, but actually supportive of bitcoin. While diminishing its share of trading volume in actual transaction flows, it shields bitcoin from being demand driven and makes it a more attractive store of value.

Now, to assess the future value of bitcoin we need to answer three questions:

I.  Is there a need for digital gold?
II. Is bitcoin more like gold or more like fiat?
III. Why bitcoin specifically?

I am not going to spend time on question one; I assume that my readers appreciate the advantage of having digital value storage and I have nothing to add to the already existing discussion.

Regarding, question two, we need to address the issues of altcoins and forks. I have already explained why I think altcoins are no more dilutive to digital gold than platinum or palladium are dilutive to physical gold. And if physical mining for gold is alive and well, so will be the digital mining for digital gold.

Forks are a trickier issue because they cause many to liken a crypto-asset to fiat, and the community of miners to central bankers. So, are forks inflationary (and for the purposes of this post I use the example of recent bitcoin hard fork)?

One definition of inflation is “the tax on capital”. It describes what happens to the purchasing power of your asset if it just sits there doing nothing. Therein lies the distinction between bankers printing more money and the blockchain forking. New fiat does not go proportionately to the holders of existing money; rather it goes where the government directs it (some cynics seem to think it tends to end directed to the richest of us) via specific asset purchases such as QE or via targeted fiscal stimulus such as tax cuts or increased spending. While those things are happening, your savings may indeed be eroded.

But the hard fork gave each current holder an extra asset. Theoretically, it is a zero-sum game, but like just like stocks tend to react positively to a stock split, this particular fork went well for the asset owners. For what it’s worth, I think the fork was more like a dividend than like split, but this is not the most relevant debate here.

I think it is obvious that forks do not TAX the capital of current holders. A more interesting question, however, is posed by forward contracts. If I promised you delivery of a bitcoin on July 1st, 2017 or September 1st, 2017 this contract may have had a different value depending on how it was written.  Forward stock value, for example, dips down on the ex-dividend date. From my perspective, therefore, it is not so much an issue of forks being inflationary, but the necessity to program blockchain contracts carefully.

If the government one day announced that every dollar is to be exchanged overnight into ten dollars it would not be inflationary in itself because the purchasing power of existing money wouldn’t change. But it would be important to know what happens to existing contracts and liabilities. If you have a salary or pension guarantee, does it go up 10 times? What about debt payments? If it is all done proportionately, there is no economic impact. But if it’s done selectively a wealth redistribution could happen.

Lastly, why bitcoin specifically? It has been discussed ad nauseam why bitcoin mining qualities and limited supply gives it aspects similar to gold. But its unique advantage with respect to other crypto-assets is that was there first. And now it is in the process of outlasting the competition.

When bitcoin first started trading, I was mostly unaware and fairly agnostic of its value. As a trader, I became interested in its vertical rise in 2013 which was followed by a bear market in 2014. Notably, its drop found support; it didn’t continue to fall to permanent obscurity below the event horizon.  Instead, it stabilized, put a solid double-bottom in 2015, and started to creep up.

XBT, Oct 2012-Oct 2016

image

This trading pattern is consistent with precious metal behavior, only compressed to a shorter horizon.  For example, look at the slow consolidation in gold after the spike of 1980.

XAU, 1975 – Present

image

Or, more recently palladium after the spike of 2001.

XPD, 1995 – Present

image

Given the historical trading pattern in precious metals, the buy of bitcoin in 2015 was relatively easy.  But now, at 20X (including fork) the early prices, it is a more complicated trading dilemma. Bitcoin may or may not be a “bubble”, but it is important to remember that it did have a major “burst” in 2014 and, even this year, the market has witnessed bitcoin endure two meaningful corrections.

XBT, 2017 (Actual price swings were even wider than BBG-sourced data below)

image

And every time it survives and stabilizes, it gets extra “gold cred”.

In summary, despite the rise and fall of various alt coins and fork considerations, “time” works FOR bitcoin, not AGAINST it.  Every day it doesn’t disappear, it gets one step closer to a permanent status of digital gold.

Good luck!

Entering the Kyle Bass US Yield Curve discussion…

I greatly enjoyed watching Raoul Pal’s latest interview with Kyle Bass, entitled “Tipping Point for China” on RealVisionTV. While my eagerness to hear the discussion was rooted in hearing Kyle’s current views on China, many other ideas and subjects surfaced as always happens during such talks.

In particular, the shape of yield curves in the developed markets caught my attention. Kyle was concerned about the supply shock of bonds which would be caused by the Fed unwinding its balance sheet and by the ECB tapering. This led him to expect higher long-dated interest rates and a curve steepening. Interestingly; Raoul emphatically agreed with the steepening bias, but his motivation was that he expected a deflationary rollover of the economy and an imminent easing in the front end.

I find myself unable to resist the temptation to wade into this debate. First and foremost, the US yield curve has been flattening, flattening, and then some more flattening. Why? Well, there are a few completely unambiguous lessons I have learned over my 20 years in the market, and one of them is that the hiking cycle equates to a flattening curve. Flattening starts before the market anticipates it; and flattening goes on for longer and deeper than one would expect. Flattening in every portion of the curve even where economically it doesn’t make sense. Flattening, period.

US 2s-10s vs FF, Jan 1999-Present

image

Raoul’s point is exactly the opposite side of this coin; easing means steepening. And you can easily see it on the charts above immediately after the orange-shaded boxes. I don’t have any proprietary way of estimating how soon the easing may come, but it tends to arrive sooner than expected, in fact, on average only a few months after the final hike of a cycle.

I am tempted to argue “this time is different”; current front-end rates are low enough that scope of a steepening rally may be limited by the zero rate (or small negative) bound. But this seems intellectually inconsistent after my flattening spiel.

Even assuming I accept that easing equates with steepening, until proven otherwise, I am left with the dichotomy between the observable fact of the current hiking cycle and the speculation about the future easing cycle.  

An even more complex dilemma that bond bulls, like myself, have to face is the specter of the QE/balance sheet unwind. Kyle brought up the supply shock worry that is expressed by many. In fact, there is an opinion out there that developed market sovereign debt is a huge bubble propped up by Central Bank purchases and is bound to implode in the near future. And while I generally disagree, I can’t deny the risk is real and material.

As I speak of the reasons why I hold a different conviction, I want to point out my arguments mostly pertain US Treasuries (“USTs”) and, to some extent, Japanese Government Bonds (“JGBs”), but probably less so to European sovereigns, which are idiosyncratic.

I. The secular total return bull market in USTs started decades ago and has not changed its shape, pattern, or velocity with the advent of QE and tapering.

US Long-Bond Futures (Total Return Chart)

image

II.The demand for USTs appear to be extremely elastic, making a supply shock unlikely. Furthermore, USTs are an asset and they don’t dictate the overall level of interest rates. At most, supply/demand can push swap spreads up and down. To illustrate the point, remember “the vanishing Treasury supply” in the Clinton Era.

Well, in the middle of all the repurchases, the 10 year rate peaked at 6.78% in 2000. Swap rates were even higher on a relative basis with the 10 year swap spread blowing out to 138bp four months later during the same year.

US 10yr Yields vs US 10yr Swap Spreads, January 1999 to December 2000

image

Meanwhile, all the debt expansion of the recent decade along with the tapering of QE didn’t stop rates from falling to the lows of 1.35% in 2016.  And swap rates overshot the downside with the spread touching -0.18% (negative!) in November, 2016.

Of course, there were other forces involved including an obvious negative correlation between economic growth and Treasury supply (Keynesian fiscal policy). Still, it is very hard to argue that UST supply drives US rates.

III. From an economic perspective, balance sheet (“B/S”) unwind is unequivocally bullish for USTs. A similar argument can be applied to a hawkish short-term rate policy; it achieves economic slowdown and lowers inflation expectations.  However, B/S unwind is even more positive because it accomplishes a tighter money supply without actually increasing the cost of carry for long-dated bonds. One could argue that the economic argument may not matter if there is simply more sellers than buyers, but for this, I would refer again to point II. Short-cycle gyration of the long bond prices can be quite vicious, but the economic gravity tends to win.

To summarize, a new easing cycle is something to deal with when it arrives and the supply shock is something worth fading, but not without peril.

Good luck,

Alex Gurevich

When can traders out-economize the economists?

When can traders out-economize the economists?

In both my public comments and investor correspondence, I have been consistently emphasizing the importance of separating expert opinions from layperson’s hunches. Applying this advice to myself, I try to rely on my strategic edge rather on my economic forecasts.

In fact, taking this point even further, I don’t rely on anyone’s economic forecasts.  But it is not because I consider the analysts who produced those views incompetent. Indeed, there are those with intellectual frameworks I highly respect. Still, for every well thought-out argument, there is an opposite one equally well-substantiated.

Current US economy and stock market bulls and bears are a great example; both camps have excellent charts, statistics, and qualitative opinions. When two experts I respect disagree so strongly, I have no choice but to believe the future is uncertain. And forecasts from either side have little value other than establishing a paradigm.

So are there times when traders can see something economists do not? The jury is still out on this one. I’m convinced more often than not that market professionals delude themselves by thinking their hunches regarding a particular unemployment number or inflation statistic have predictive power.

But I believe there is one area in which traders may have an edge: we tend to have a strong sense of momentum. While the analysts measure where things are, traders think in terms of where things are going. Thus, when a business cycle turns, traders may have a stronger strategic commitment to a nascent economic trend.

I will not use the cycle turning of 2007-2008 as an example – it was too unusual. But I remember well 2000-2001. The NASDAQ index started to collapse throughout 2000, while the Fed raised rates 100bp in the first half of the year and kept them flat at 6.5% for the remainder of the year.  Only towards the end of the year in 2000 did the Fed begin to initiate mild talk of a potential economic slowdown.  

NASDAQ vs FED Funds Target Rate, 2000 – 2003

image

To be sure, the central bank accepted recession being a real risk early in 2001 and started cutting rates aggressively. But not aggressively enough even though we in the trenches were quite sure that the dot.com bust was leading to the inevitable recession and a much deeper fall in interest rates. For the younger market participants, I will remind that the recession was not caused by September 11th. It was a virtual certainty months before. I even suspect that the terrorist attack, in fact, accelerated the recovery by forcing the Fed to ease even faster and by bringing stimulus into the economy.

I remember that sense of confidence: “blah blah blah, whatever the research says,” the rates are going down! Of course, for every time one could have been right this way and made a fortune, there could be several false starts; traders reading too much into a transitory data shift. I cannot prove or disprove the value of this momentum sense. I am just bringing it to your attention and judgment.

Why am I writing about this today? Over the last few weeks, my momentum sense started to tingle. The recent fall in oil prices and core inflation together with other incrementally soft data are beginning to signal the roll-over of the cycle and the bond markets are running with it. Meanwhile, the analysts are still vigorously debating.

Crude, US Surprise Index, Core PCE (y/y), June 2016 to present

image

To re-emphasize:  my bullish bond position is not contingent on this current perception but on my strategic framework which is independent of forecasts. The cycle does not have to end today, I can wait to make money tomorrow.

But I can’t help having a hunch – value or no value.

Good luck,

USDCHF – A French Election Trade

Market
participants, remembering the impact of Brexit, have their focus on France this
weekend. The last thing I want to do is add into the
mix my futile hunches regarding the probabilities of various winning candidate
permutations. Furthermore, wI won’t even speculate how the market will react to
any particular second round match-up.

The purpose of
this note is to discuss a rare, tactical conviction over this weekend.
Staying COMPLETELY AGNOSTIC as to whether the election outcome will be taken as
Eurozone positive or negative, consider USDCHF. 

Scenario I
The outcome is
perceived as negative; fueling French EU exit fears (‘disenfrancising’) and
risk-off trades such short USDJPY, short equities, and long US Treasury bonds
are expected to benefit. EURUSD is likely to fall and underperform CHF.
However, given the close linkages, CHF is likely to be dragged down by the EUR
and, unlike JPY, underperform the US dollar. So, in this scenario, we expect
USDCHF to gain.

Scenario II
The outcome is
perceived as positive; risk-on trades, such as long equities, are expected to
benefit. US and European risk-free rates are likely to trade higher.  EUR
will likely outperform CHF and possibly by a lot, as Swiss interest rates are
more pinned, and USD will rally against safe harbor currencies such as JPY and
CHF. So, in this scenario, we expect USDCHF to appreciate.

To
re-cap, USDCHF
goes up, or USDCHF goes up.

It is
important to underscore that when I talk of tactical conviction, I don’t mean
“I am positive that this
trade will make money,” rather I mean “I am convinced that this is a positive expectation
trade.”

Markets are
finicky, and even with the logic above I can assign no higher than 60% chance
of being correct.

And we I am fully prepared to be completely wrong.

Hence, I am purposefully posting at the end of the trading day not to entice the reader to
follow our trade, but to share and “timestamp” my thinking, which typically
applies to the long investment horizon, but in this unique case may have a
short-term value.

Good luck this
weekend!

Not Forecasting 2017

Year end is a sweet time for bashing forecasters.  Many investors take a savage delight in pointing how comically off particular economists or analysts were on this or that price, or event, in 2016.  And then, without hesitation or irony, they proceed to read the forecasts for 2017.

Yogi Berra and others have said:
“It is difficult to make predictions, especially about the future.”

But instead of making light of forecasters, I will briefly discuss some limitations of using forecasts for trading.

There is a fundamental difference between analytical and strategic thinkers.

  • Analytical thinkers focus on facts and evidence; partitioning or breaking down information into mutually exclusive categories with a goal of generating a solution to a problem.
  • Strategic thinkers design systems of responses to various future situations, foreseen and unforeseen.

A great macro trader should at least be decent at one of those and a genius at the other.

I have always balked at questions such as “Where do you see the Euro at the end of the year?”  Somehow even trying to think in those terms annoys me. In my book (Chapter 7), I advise specifying one of two features for every trade: time horizon or price target.  Trying to do both seems too arrogant.

But forecasters are not stupid; they know the future is uncertain, but they are given a problem and need to come up with a number (e.g. GDP, exchange rate, election outcome, etc.). They are paid to deliver a prediction, and they do their best.

I.  The first and simplest forecasting problem is determining the difference between the Expected Value (EV) and the most likely outcome.

The most likely outcome is what I call the “Central Scenario” – the direction things are heading if everything plays out most or less as expected (it rarely does!).  

For example, a few months ago we could have correctly forecasted a single hike by the Federal Reserve that occurred in December.

The problem with the Central Scenario is it does not express in which direction the market is more likely to stray.  This problem has been a fundamental issue, for example, with the continuously mispriced interest rate curve.  For decades, both interest rate forwards and economists perpetually overestimated the average level of interest rates over any meaningful period.

For some charts and numbers, look up Chapters 2 and 3 of my book.

Over the last 40 years, short-term interest rates have exhibited a much stronger propensity to move dramatically lower than higher due to an exogenous event such as the Russian debt crisis, 9/11 or the Global Financial Crisis. To put it, in other words, there are surprise eases, but not surprise hikes.

It is not difficult to see how, over the long run, the outcome favors the bond bulls.  

It is important to understand that forecasters are likely to aim for what they think to be the Central Scenario as it maximizes their chances of actually being close to right.

By way of example, consider the extreme case of betting $1 on “tails” on a coin toss. The tail-ish economists will forecast a $1 gain, while the heads-ish ones a $1 loss, both hoping to be right more than 50% of the time. But those who forecast $0, have no chance to be right!

Critically, it is up to traders to understand the paradigm and maximize the value of their portfolios.

II. The more subtle and pernicious problem has to do with creating a variant forecast.

So far we haven’t considered the divergence between forecasts and market forwards. But for a trader, only a variant view is of any value. If there is no such divergence – there is no trade.

Now an analyst trying to forecast, say, the year-end level of EUR/USD would have to deal with multiple moving inputs such as equities, interest rates, and commodities, not to mention geopolitical variables. To derive a Central Scenario, the analyst will use what they think are the Central Scenarios for each of the inputs whether or not they are aligned with market forwards.

Therein lies an enormous logical fallacy that few traders in my experience escape: 

Unconsciously basing positions on a forecast for one asset class, which is relying on the divergent outcome of other asset classes.

Asset class interactions are discussed in Part III of my book, especially Chapters 11 and 12, but I will give just one example here.

At the beginning of 2016, there were a number of dollar bears (or at least skeptics). But when I dug deeper into their thinking, more often than not it turned out that their dollar view was predicated on the fact that the US economy was close to rolling over and the Fed was not likely to hike again or may even ease.

Yet, the market was predicting even more hiking than would actually happen for 2016. December Eurodollar futures ended the year far off the highs, but still higher than where it had started. And if one aligned with the earlier market forward, the dollar bearish view was unreasonable.

EDZ16 <Comdty>, 2016

image

I have written many times how long dollar and long bond trades have been strictly superior to their opposites.

Indeed, classic bond futures have played out exactly as predicted by markets for two consecutive years (i.e. no P/L on a total return basis), in the environment of very robust job data.

Classic Bond Futures, 2014-2016

image

Meanwhile, the dollar index (we are charting DXY price which is conservative as dollar also has positive carry) made substantial gains in both years.

DXY <Curncy>, 2014-2016

image

It is not that dollar bears were wrong. We have all been both right and wrong multiple times. Rather the point is they would have done better by going to the origin of their view and being long bonds.

Good luck and Happy New Year!

Priced To Perfection?

Trumponomics

For
over two solid weeks after the election, the markets have been relentlessly
pricing in the success of “Trumponomics.”
To be clear, we mean “success” in a purely non-partisan manner. It just means the President-Elect would accomplish what he says he is going to
accomplish, whether that might be good or bad in an individual’s view.
Furthermore, we discuss economic causality only to the extent it affects
financial markets, or more precisely, how it defines superiority and dominance
relationships between specific trades.

With
that in mind, let’s start untangling Trumponomics with its flagship item:
infrastructure stimulus. Long on the Democrats’ agenda, the package of $500bln
to $1tln is now expected to pass through the Republican Congress. Without
offering our amateur political analysis, we point out that this may or may not
happen.

By
“expected,” we mean the price action in:

  • Equities;
  • Industrial commodities; and
  • Inflation break-evens.

Surely,
if the stimulus were to pass, all else being equal, it would provide a tailwind to all of the above. But, the
magnitude of the move thus far has already been substantial enough to make us
question if betting against the stimulus is taking on a characteristic of an “Even If” trade discussed in Chapter 13 of The
Next Perfect Trade
. The argument being that there are occasions when the
market pricing is so skewed towards one outcome, that betting on the opposite
outcome may make money even if
the most expected event comes to pass.  

The
recent price action in pertinent markets:

US Equities: 1m Historical

image

Copper:
1m Historical

image

5Year US Inflation Breakeven: 1m
Historical

image

FED
Response

Now
let’s shift the discussion to the Federal Reserve. Should the stimulus pass,
the Fed would consider the rising inflation expectations justified, based on
the triple impact of:

  • Rising commodity prices;
  • Tightening labor markets; and
  • Wealth effect from the stock market.

Importantly,
the Fed was well on track to tighten imminently regardless of the election
outcome, so in this case the EVEN IF trade points us in the direction aligned
with Trumponomics. There have been debates on whether the current Federal
Reserve is too tight or too easy. We elected to stay on the sidelines but
consistently highlighted that the Fed is indubitably hawkish relative to other DM central banks.

Though
Trump criticized Yellen during the campaign, we are not sure how much of that
was purely political rhetoric, and what he would rather she do or not do. What
we know is that Ms. Yellen is likely to stay on for the remainder of her term
and to pursue her policy framework. As for what
comes after, we would posit that the President-Elect has a good understanding
of debt and interest rates; he would likely “push” for a policy that would
neither stifle the economy through excessive hikes nor allow inflation
expectations to run away leading to a catastrophic steepening of the borrowing
curve.

We
pointed to the limitations of the curve shape as a leading indicator in our
post, Flat
Curves & Recessions
, from September 28th, but steepening is
often viewed as a good thing as it is associated with periods of solid economic
growth. On the other hand, as the United
States has a considerable current account deficit, higher rates are net
negative for the wealth of the nation (more interest going to foreigners), and
this is something Trump may be aware of.

Overall,
we see no reason for the new administration to nudge the Fed to one extreme or
another, so ‘business as usual’ is our best guess.

What Does This Mean for The
dollar?

The
US dollar (USD) has strengthened a lot on the back of Trumponomics. This price
action is consistent with the notion of a
reasonably vigilant Fed, which would raise REAL interest rates in response to
higher inflation expectations.

USD: 1m Historical (DXY)

image

Recent
re-price of the markets notwithstanding; we continue to maintain that
stronger dollar is a concurrent necessity with
respect to higher interest rates. In other words, if US rates stay where
they are or move higher, the USD should continue to perform well on a total
return basis. For those who feel that the dollar rally has gone too far, we would refer to our post
from March of this year
and point out that given the rates differentials,
the current 10-year forwards in EURUSD,
USDJPY, and USDCHF are 1.3150, 84.00, and 0.7500, respectively.

As
we have long noted, ECB, BOJ, and SNB do not have to ease further to weaken
their currencies; all they have to do is to hold steady and let the Fed lift
off.

Most
dollar bears base their view on the implicit necessity of the US rates playing
out much lower than currently projected. Our logic then dictates that betting
on lower rates is the dominant trade.

Let’s
Talk About the Transmission Mechanisms

Higher
rates and stronger dollar traditionally are seen as a recipe for a deflationary
slowdown.

As
an aside, we acknowledge the point of view that in a stronger final demand
environment, higher rates may, in fact,
be inflationary as they increase the production costs. We, however, stick with
the simple perspective that real rates are “the cost of money.” And if the cost rises, well then money
becomes more expensive, i.e. deflation. Of course, a further nuance may
be possible arguing that higher rates are mostly deflationary for asset prices,
not consumer goods – a theory well supported by the fact that recent low rates
have helped asset prices much more than wages.

We
are acknowledging those arguments to emphasize serious uncertainties and
complexities in the rates mechanism, but we will stick to the simple
observation that “too high rates” typically lead to a collapse in the stock market, which is often followed by an economic slowdown.  

We
have long argued for the negative predictive power of interest rates and that
perpetually upward sloping and steep
yield curves, provide a tailwind for the secular bond bull market.

The
dollar rise should be even less controversial, as it incrementally leads to
weaker exports and lower imports prices.

So,
on an “all else being equal” basis, the recent shift to higher rates and stronger
dollar equates to a tightening monetary condition and should lead to lower
inflation expectations, a flatter yield curve,
and lower equity prices.

This
transmission mechanism is challenged by
the market’s acceptance of the Trumponomics. The higher rates would be offset by the stimulus and the impact to trade from a higher
dollar by import taxes. Tariffs being another “may or may not happen”
proposition.  We will not even go into
the risk of a global slowdown caused by potential
trade wars.

It
is sufficient to say that the tightening of economic conditions is present here
and now, and stimulus and tariffs are
something that might happen in the future and just might have the expected
effect.

As
you may guess, we continue to argue for
our portfolio strategy; a combination of long US bonds and long US dollar
against DM currencies.

When
addressing bonds, it is important to
mention the credit risk which may increase
with Trump’s potential expansion of the budget deficit and his rhetoric,
however unlikely, regarding a “workout” on the US debt.

Long-dated bonds have cheapened significantly
over the last few days on an asset swap basis, some of them approaching the
level of Libor + 60 bps. Some have viewed that relationship as mathematically impossible
and attribute it purely to technicals related to the Dodd-Frank limitations of
balance sheet and foreign CB selling.

As
we wrote in a blog post a year ago, it is not exactly as simple as that.  

However,
setting technicals aside, the only economic justification for the current levels is the pricing of at least 100bps of credit risk. This, in itself, implies something like 80
cents on the dollar workout on long-dated
bonds, which in our view is extremely conservative.

There
is no doubt that the Trump victory has introduced more uncertainty into the
rates environment, but we are well compensated
for this.  For example, while we would
rather be long bonds with Clinton than with Trump at the same level, we prefer
to be long bonds with Trump for an extra 100 bps.

And
finally, for what it’s worth, both the magnitude and velocity of the recent
correction are entirely consistent with
multiple, recent corrections including:

Long-Bond Futures: Corrections of 1994,
‘00, ‘02, ’06, ’09, ’11, ’13, ’15, ‘16

image

For now,
the One Chart still rules them all.

Good
luck!

Flat Curves and Recessions

All too often I hear sentences like “The bond market and the stock market say opposite things about the economy” or “A flat curve means recession, so if you expect the curve to get flatter that means you are expecting an imminent recession”.

The purposes of this post are to dig a little deeper into the concepts of concurrencies and causality associated with the yield curve and to challenge some of the common assumptions embedded in the statements above.

While the “Freakonomics” crowd loves debunking confusion between correlation and causality, I will instead write in terms of the distinction between “causes” and “indicators” and, furthermore, between “leading” and “concurrent” indicators.

My strategy mostly deals with causes. In my book, I discuss how causal relationships between two market events can be characterized in terms of necessity and concurrency and how to trade based on such characterization.

By way of example, the Fed moving to tighter monetary policy has a clear causality relationship with a stronger dollar and a flatter US yield curve. As always, some would disagree even with this paradigm. But I am comfortable with this causality being if not as “certainty”, but an at least a “certain likelihood”. 

In my book, I have demonstrated how, in 2014, the stronger dollar was a concurrent necessity with respect to rising rates and thus a dominant trade. That meant by the time the Fed tightened, dollar would have to have strengthened but it might have (and did!) strengthened even without the tightening.

There are, however, highly correlated pairs of market events with a more obscure causality relationship. For example, up until 2016, USDJPY traded in high correlation with all risk assets, including not only the Nikkei but also the S&P 500. In my post, The Tale of Three Shorts, I have discussed some of the complexity there and even suggested that strong JPY trade may be a self-defeating chicken (a thesis yet to be verified). To put in simply, the correlation was obvious to me, but the causality wasn’t.

In such situations, I refer to events as “indicators” rather than “causes”. I have several times heard sentences like “weaker USDJPY spells trouble for stocks”. Such statements irked me as logically flawed, but the fallacy is not immediately obvious. Indeed, stocks tend to go down when JPY strengthens, don’t they?

This is where I introduce the notion of the concurrent indicator. If I look at my screen and see USDJPY up on the day and don’t look at anything else – what is my guess about the stock market? Of course, it’s more likely that the stocks are up. But why shouldn’t I look at anything else? I have a full screen of prices available.

My point is that USDJPY doesn’t convey any information about equities that I can’t see by looking at the equity screens. Yes, usually when USDJPY falls, S&P 500 trades lower as well, but if it did not go down there is no obvious ECONOMIC causality saying that it has to catch up. So, as I see it there is little predictive power to gain from divergence in this pair; what has happened, already happened. And with this mindset I was not at all shocked with the divergence of this year.

5Yr Chart of USDJPY (White) vs SPX (Yellow)

image

But what about the clearly statistically confirmed “leading” indicators? My contention here is that even those may not convey as much useful information as appears.

As you can guess, I am taking a swipe at the maxim that flat yield curves forecast recessions and steep yield curves forecast robust economic growth, which appears to be accepted by market participants almost without question.

The evidence is undoubtedly strong – flat curves indeed preceded all the recent recessions. But my question is, “does the curve convey any information about the possibility of a recession, we don’t have otherwise?”

Imagine that you have jumped from the roof of a high-rise. Falling past the 10th floor is a very reliable indicator of soon hitting the ground, but what new information does it contain?  Given that you jumped off consciously and are familiar with the law of gravity – none.

What if you fell while sleeping? Well, waking up to see the 10th-floor flash by is definitely good info. But returning the analogy to macro-trading, my assumption is that you are not asleep.

Then what if the law of gravity changes? In this case, the 10th floor may not even be a reliable leading indicator anymore.

Over the last few decades, we got used to certain patterns of the business/rates cycle. Events were happening in a certain order and over certain predictable time intervals:

1.       Rapid economic growth

2.       Tight labor market and inflationary pressure

3.       Rising rates

4.       Yield curve flattening

5.       Hiking cycle

6.       Bear stock market

7.       Rates fall

8.       Growth slows down

9.       Easing cycle

10.   Curve steepens

11.   Stock market rebounds

12.   Rapid economic growth

Notice, any of the events in this loop could be used as reliable leading indicators for any subsequent events. Assuming the loop persists.

As I have discussed in Chapter 4 of my book, historical patterns are important to study because they are more likely to repeat than not. But if we make an a priori assumption that this loop will just keep going on without alteration – we almost wouldn’t need to observe anything else – we would already know what happens next.

In that chapter, I gave an example of using interest rate momentum as a predictor of future stock market price action. That is, I showed a decent fit between the two-year backward looking change in the 10-year note yield and the two-year forward-looking change in S&P 500. In the loop above it would mean bullet point 7 (rates fall) is a leading indicator of 11 (stock market rebounds).

Backward-Looking Change in 10yr Yields vs Forward-Looking Change in S&P500 

image

Why is there good information in this pattern? My claim is that the information is there because there is CAUSALITY. Lower funding rates lead to improved corporate profits. And this simple paradigm lends extra strength to my pattern argument.

When, however, people make the assumption that 4 (yield curve flattening) predicts 8 (economic slowdown), their assumptions are not backed up by direct causality. This does not imply the indicator is wrong, but rather it makes it more fragile.

In the past decades, 4 (yield curve flattening) was typically associated with 5 (hiking cycle). However, as we have approached zero rates and entered the world of QE, the laws of gravity have changed. Curves in the developed world are flattening in the LOW rate environment and they are no longer backed by the causality of the increased funding cost.

The jury is out on whether in the new environment yield curves will reliably forecast the business cycle. My contention is that they are unlikely to carry any information not already familiar to an alert macro player.  For myself, I will stick to indicators resting on the simple and evident logic of causality.