I greatly enjoyed watching Raoul Pal’s latest interview with Kyle Bass, entitled “Tipping Point for China” on RealVisionTV. While my eagerness to hear the discussion was rooted in hearing Kyle’s current views on China, many other ideas and subjects surfaced as always happens during such talks.
In particular, the shape of yield curves in the developed markets caught my attention. Kyle was concerned about the supply shock of bonds which would be caused by the Fed unwinding its balance sheet and by the ECB tapering. This led him to expect higher long-dated interest rates and a curve steepening. Interestingly; Raoul emphatically agreed with the steepening bias, but his motivation was that he expected a deflationary rollover of the economy and an imminent easing in the front end.
I find myself unable to resist the temptation to wade into this debate. First and foremost, the US yield curve has been flattening, flattening, and then some more flattening. Why? Well, there are a few completely unambiguous lessons I have learned over my 20 years in the market, and one of them is that the hiking cycle equates to a flattening curve. Flattening starts before the market anticipates it; and flattening goes on for longer and deeper than one would expect. Flattening in every portion of the curve even where economically it doesn’t make sense. Flattening, period.
US 2s-10s vs FF, Jan 1999-Present
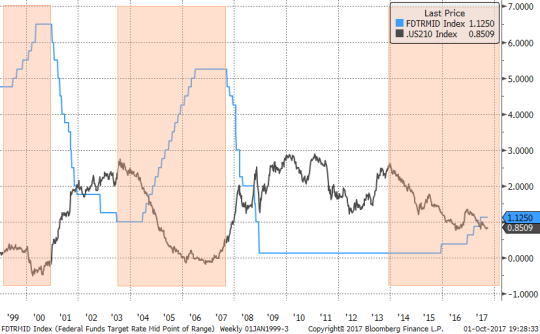
Raoul’s point is exactly the opposite side of this coin; easing means steepening. And you can easily see it on the charts above immediately after the orange-shaded boxes. I don’t have any proprietary way of estimating how soon the easing may come, but it tends to arrive sooner than expected, in fact, on average only a few months after the final hike of a cycle.
I am tempted to argue “this time is different”; current front-end rates are low enough that scope of a steepening rally may be limited by the zero rate (or small negative) bound. But this seems intellectually inconsistent after my flattening spiel.
Even assuming I accept that easing equates with steepening, until proven otherwise, I am left with the dichotomy between the observable fact of the current hiking cycle and the speculation about the future easing cycle.
An even more complex dilemma that bond bulls, like myself, have to face is the specter of the QE/balance sheet unwind. Kyle brought up the supply shock worry that is expressed by many. In fact, there is an opinion out there that developed market sovereign debt is a huge bubble propped up by Central Bank purchases and is bound to implode in the near future. And while I generally disagree, I can’t deny the risk is real and material.
As I speak of the reasons why I hold a different conviction, I want to point out my arguments mostly pertain US Treasuries (“USTs”) and, to some extent, Japanese Government Bonds (“JGBs”), but probably less so to European sovereigns, which are idiosyncratic.
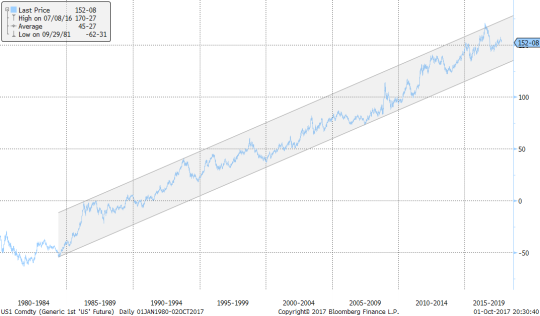
I. The secular total return bull market in USTs started decades ago and has not changed its shape, pattern, or velocity with the advent of QE and tapering.
US Long-Bond Futures (Total Return Chart)
II.The demand for USTs appear to be extremely elastic, making a supply shock unlikely. Furthermore, USTs are an asset and they don’t dictate the overall level of interest rates. At most, supply/demand can push swap spreads up and down. To illustrate the point, remember “the vanishing Treasury supply” in the Clinton Era.
Well, in the middle of all the repurchases, the 10 year rate peaked at 6.78% in 2000. Swap rates were even higher on a relative basis with the 10 year swap spread blowing out to 138bp four months later during the same year.
US 10yr Yields vs US 10yr Swap Spreads, January 1999 to December 2000
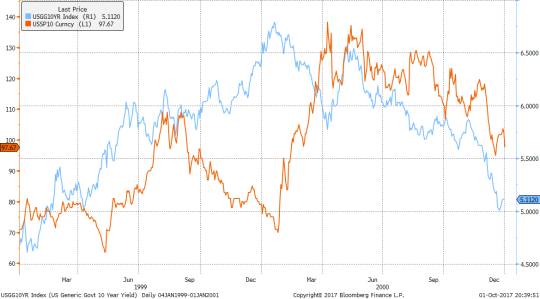
Meanwhile, all the debt expansion of the recent decade along with the tapering of QE didn’t stop rates from falling to the lows of 1.35% in 2016. And swap rates overshot the downside with the spread touching -0.18% (negative!) in November, 2016.
Of course, there were other forces involved including an obvious negative correlation between economic growth and Treasury supply (Keynesian fiscal policy). Still, it is very hard to argue that UST supply drives US rates.
III. From an economic perspective, balance sheet (“B/S”) unwind is unequivocally bullish for USTs. A similar argument can be applied to a hawkish short-term rate policy; it achieves economic slowdown and lowers inflation expectations. However, B/S unwind is even more positive because it accomplishes a tighter money supply without actually increasing the cost of carry for long-dated bonds. One could argue that the economic argument may not matter if there is simply more sellers than buyers, but for this, I would refer again to point II. Short-cycle gyration of the long bond prices can be quite vicious, but the economic gravity tends to win.
To summarize, a new easing cycle is something to deal with when it arrives and the supply shock is something worth fading, but not without peril.
Good luck,
Alex Gurevich

CIO, HonTe Investments. Ran global macro at JPM. Yahoo! Finance Contributor. Ph.D. in Mathematics. Author, The Next Perfect Trade. No investment advice.