Trumponomics
For
over two solid weeks after the election, the markets have been relentlessly
pricing in the success of “Trumponomics.”
To be clear, we mean “success” in a purely non-partisan manner. It just means the President-Elect would accomplish what he says he is going to
accomplish, whether that might be good or bad in an individual’s view.
Furthermore, we discuss economic causality only to the extent it affects
financial markets, or more precisely, how it defines superiority and dominance
relationships between specific trades.
With
that in mind, let’s start untangling Trumponomics with its flagship item:
infrastructure stimulus. Long on the Democrats’ agenda, the package of $500bln
to $1tln is now expected to pass through the Republican Congress. Without
offering our amateur political analysis, we point out that this may or may not
happen.
By
“expected,” we mean the price action in:
- Equities;
- Industrial commodities; and
- Inflation break-evens.
Surely,
if the stimulus were to pass, all else being equal, it would provide a tailwind to all of the above. But, the
magnitude of the move thus far has already been substantial enough to make us
question if betting against the stimulus is taking on a characteristic of an “Even If” trade discussed in Chapter 13 of The
Next Perfect Trade. The argument being that there are occasions when the
market pricing is so skewed towards one outcome, that betting on the opposite
outcome may make money even if
the most expected event comes to pass.
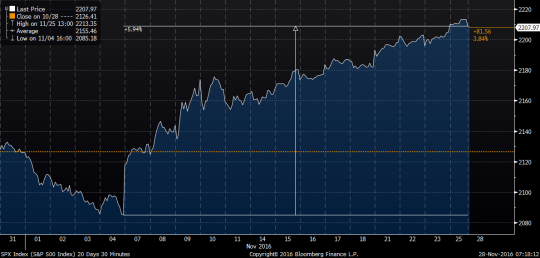
The
recent price action in pertinent markets:
US Equities: 1m Historical
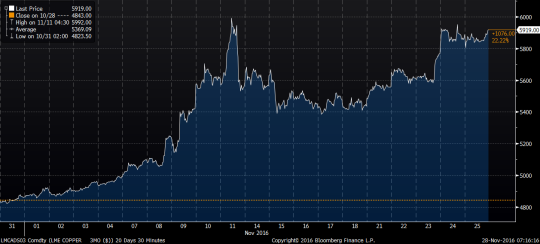
Copper:
1m Historical
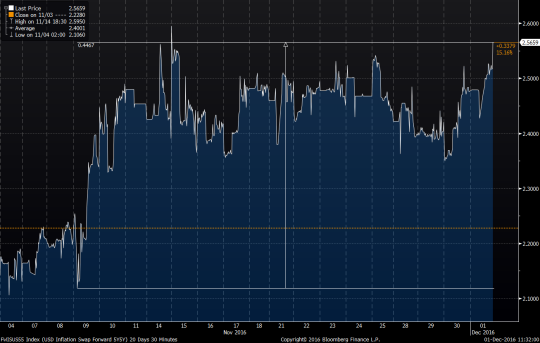
5Year US Inflation Breakeven: 1m
Historical
FED
Response
Now
let’s shift the discussion to the Federal Reserve. Should the stimulus pass,
the Fed would consider the rising inflation expectations justified, based on
the triple impact of:
- Rising commodity prices;
- Tightening labor markets; and
- Wealth effect from the stock market.
Importantly,
the Fed was well on track to tighten imminently regardless of the election
outcome, so in this case the EVEN IF trade points us in the direction aligned
with Trumponomics. There have been debates on whether the current Federal
Reserve is too tight or too easy. We elected to stay on the sidelines but
consistently highlighted that the Fed is indubitably hawkish relative to other DM central banks.
Though
Trump criticized Yellen during the campaign, we are not sure how much of that
was purely political rhetoric, and what he would rather she do or not do. What
we know is that Ms. Yellen is likely to stay on for the remainder of her term
and to pursue her policy framework. As for what
comes after, we would posit that the President-Elect has a good understanding
of debt and interest rates; he would likely “push” for a policy that would
neither stifle the economy through excessive hikes nor allow inflation
expectations to run away leading to a catastrophic steepening of the borrowing
curve.
We
pointed to the limitations of the curve shape as a leading indicator in our
post, Flat
Curves & Recessions, from September 28th, but steepening is
often viewed as a good thing as it is associated with periods of solid economic
growth. On the other hand, as the United
States has a considerable current account deficit, higher rates are net
negative for the wealth of the nation (more interest going to foreigners), and
this is something Trump may be aware of.
Overall,
we see no reason for the new administration to nudge the Fed to one extreme or
another, so ‘business as usual’ is our best guess.
What Does This Mean for The
dollar?
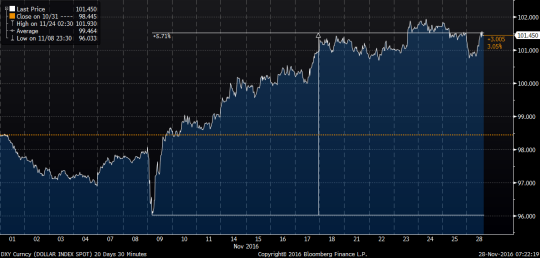
The
US dollar (USD) has strengthened a lot on the back of Trumponomics. This price
action is consistent with the notion of a
reasonably vigilant Fed, which would raise REAL interest rates in response to
higher inflation expectations.
USD: 1m Historical (DXY)
Recent
re-price of the markets notwithstanding; we continue to maintain that
stronger dollar is a concurrent necessity with
respect to higher interest rates. In other words, if US rates stay where
they are or move higher, the USD should continue to perform well on a total
return basis. For those who feel that the dollar rally has gone too far, we would refer to our post
from March of this year and point out that given the rates differentials,
the current 10-year forwards in EURUSD,
USDJPY, and USDCHF are 1.3150, 84.00, and 0.7500, respectively.
As
we have long noted, ECB, BOJ, and SNB do not have to ease further to weaken
their currencies; all they have to do is to hold steady and let the Fed lift
off.
Most
dollar bears base their view on the implicit necessity of the US rates playing
out much lower than currently projected. Our logic then dictates that betting
on lower rates is the dominant trade.
Let’s
Talk About the Transmission Mechanisms
Higher
rates and stronger dollar traditionally are seen as a recipe for a deflationary
slowdown.
As
an aside, we acknowledge the point of view that in a stronger final demand
environment, higher rates may, in fact,
be inflationary as they increase the production costs. We, however, stick with
the simple perspective that real rates are “the cost of money.” And if the cost rises, well then money
becomes more expensive, i.e. deflation. Of course, a further nuance may
be possible arguing that higher rates are mostly deflationary for asset prices,
not consumer goods – a theory well supported by the fact that recent low rates
have helped asset prices much more than wages.
We
are acknowledging those arguments to emphasize serious uncertainties and
complexities in the rates mechanism, but we will stick to the simple
observation that “too high rates” typically lead to a collapse in the stock market, which is often followed by an economic slowdown.
We
have long argued for the negative predictive power of interest rates and that
perpetually upward sloping and steep
yield curves, provide a tailwind for the secular bond bull market.
The
dollar rise should be even less controversial, as it incrementally leads to
weaker exports and lower imports prices.
So,
on an “all else being equal” basis, the recent shift to higher rates and stronger
dollar equates to a tightening monetary condition and should lead to lower
inflation expectations, a flatter yield curve,
and lower equity prices.
This
transmission mechanism is challenged by
the market’s acceptance of the Trumponomics. The higher rates would be offset by the stimulus and the impact to trade from a higher
dollar by import taxes. Tariffs being another “may or may not happen”
proposition. We will not even go into
the risk of a global slowdown caused by potential
trade wars.
It
is sufficient to say that the tightening of economic conditions is present here
and now, and stimulus and tariffs are
something that might happen in the future and just might have the expected
effect.
As
you may guess, we continue to argue for
our portfolio strategy; a combination of long US bonds and long US dollar
against DM currencies.
When
addressing bonds, it is important to
mention the credit risk which may increase
with Trump’s potential expansion of the budget deficit and his rhetoric,
however unlikely, regarding a “workout” on the US debt.
Long-dated bonds have cheapened significantly
over the last few days on an asset swap basis, some of them approaching the
level of Libor + 60 bps. Some have viewed that relationship as mathematically impossible
and attribute it purely to technicals related to the Dodd-Frank limitations of
balance sheet and foreign CB selling.
As
we wrote in a blog post a year ago, it is not exactly as simple as that.
However,
setting technicals aside, the only economic justification for the current levels is the pricing of at least 100bps of credit risk. This, in itself, implies something like 80
cents on the dollar workout on long-dated
bonds, which in our view is extremely conservative.
There
is no doubt that the Trump victory has introduced more uncertainty into the
rates environment, but we are well compensated
for this. For example, while we would
rather be long bonds with Clinton than with Trump at the same level, we prefer
to be long bonds with Trump for an extra 100 bps.
And
finally, for what it’s worth, both the magnitude and velocity of the recent
correction are entirely consistent with
multiple, recent corrections including:
Long-Bond Futures: Corrections of 1994,
‘00, ‘02, ’06, ’09, ’11, ’13, ’15, ‘16
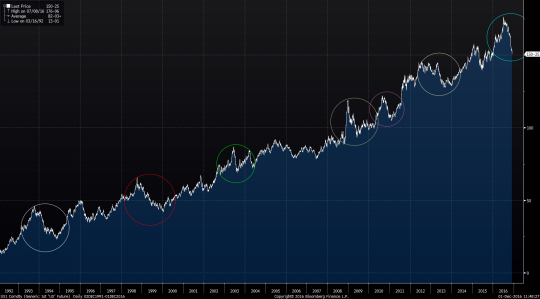
For now,
the One Chart still rules them all.
Good
luck!

CIO, HonTe Investments. Ran global macro at JPM. Yahoo! Finance Contributor. Ph.D. in Mathematics. Author, The Next Perfect Trade. No investment advice.